Readings Newsletter
Become a Readings Member to make your shopping experience even easier.
Sign in or sign up for free!
You’re not far away from qualifying for FREE standard shipping within Australia
You’ve qualified for FREE standard shipping within Australia
The cart is loading…


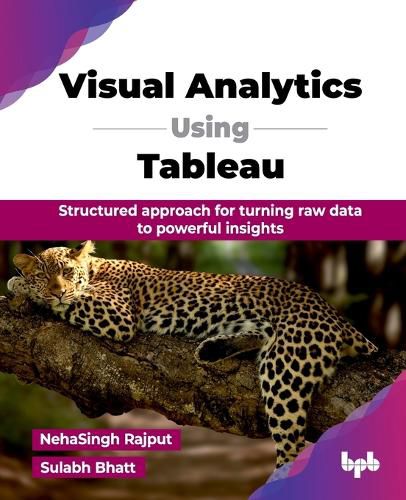
Tableau is one of the leading business intelligence and data visualization tools that fulfill almost all the requirements for getting insights from huge data and solving complex business queries using simple and complex visualizations. This book covers all the features supported by Tableau, from basics to advanced. Master data storytelling with Tableau by learning to connect, clean, and analyze data from various sources. This book covers essential chart types like bar, line, and pie charts while introducing advanced features like filters, LOD expressions, and dual-axis charts. Create interactive dashboards by combining visualizations, adding controls, and customizing designs to engage your audience. Use storytelling techniques to present insights effectively. With advanced visualizations like combo and Gantt charts, this guide equips you with the skills to communicate data clearly and make informed, data-driven decisions.
$9.00 standard shipping within Australia
FREE standard shipping within Australia for orders over $100.00
Express & International shipping calculated at checkout
Tableau is one of the leading business intelligence and data visualization tools that fulfill almost all the requirements for getting insights from huge data and solving complex business queries using simple and complex visualizations. This book covers all the features supported by Tableau, from basics to advanced. Master data storytelling with Tableau by learning to connect, clean, and analyze data from various sources. This book covers essential chart types like bar, line, and pie charts while introducing advanced features like filters, LOD expressions, and dual-axis charts. Create interactive dashboards by combining visualizations, adding controls, and customizing designs to engage your audience. Use storytelling techniques to present insights effectively. With advanced visualizations like combo and Gantt charts, this guide equips you with the skills to communicate data clearly and make informed, data-driven decisions.