Readings Newsletter
Become a Readings Member to make your shopping experience even easier.
Sign in or sign up for free!
You’re not far away from qualifying for FREE standard shipping within Australia
You’ve qualified for FREE standard shipping within Australia
The cart is loading…


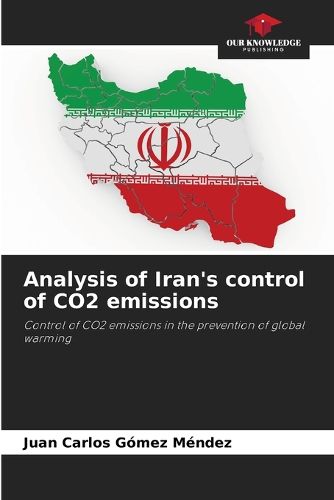
Since the Islamic Revolution of 1979, Iran has experienced considerable growth in its oil and gas industry, which has led to an increase in the burning of fossil fuels and, therefore, in CO2 emissions.this research conducted a characterization of the variables CO2 emissions and vehicles in use, a normality test was applied to the data using Shapiro Wilk analysis, a Pearson correlation test which resulted in a correlation of r= 0.9712, which means that there is a strong correlation between the two variables. Since the r value is positive, it indicates a positive relationship between the variables, growth in one variable is associated with growth in the other variable. A future projection was made using the least squares model, year by year, from 2024 to 2030, with the result that in 2024 CO2 emissions will be 763.1 Mt and these emissions will increase until 2030 up to 847.2 Mt, which puts at risk the world environmental goals of reducing CO2 emissions and maintaining the global temperature of the planet at less than 1.5 degreesC.
$9.00 standard shipping within Australia
FREE standard shipping within Australia for orders over $100.00
Express & International shipping calculated at checkout
Stock availability can be subject to change without notice. We recommend calling the shop or contacting our online team to check availability of low stock items. Please see our Shopping Online page for more details.
Since the Islamic Revolution of 1979, Iran has experienced considerable growth in its oil and gas industry, which has led to an increase in the burning of fossil fuels and, therefore, in CO2 emissions.this research conducted a characterization of the variables CO2 emissions and vehicles in use, a normality test was applied to the data using Shapiro Wilk analysis, a Pearson correlation test which resulted in a correlation of r= 0.9712, which means that there is a strong correlation between the two variables. Since the r value is positive, it indicates a positive relationship between the variables, growth in one variable is associated with growth in the other variable. A future projection was made using the least squares model, year by year, from 2024 to 2030, with the result that in 2024 CO2 emissions will be 763.1 Mt and these emissions will increase until 2030 up to 847.2 Mt, which puts at risk the world environmental goals of reducing CO2 emissions and maintaining the global temperature of the planet at less than 1.5 degreesC.