Readings Newsletter
Become a Readings Member to make your shopping experience even easier.
Sign in or sign up for free!
You’re not far away from qualifying for FREE standard shipping within Australia
You’ve qualified for FREE standard shipping within Australia
The cart is loading…


This title is printed to order. This book may have been self-published. If so, we cannot guarantee the quality of the content. In the main most books will have gone through the editing process however some may not. We therefore suggest that you be aware of this before ordering this book. If in doubt check either the author or publisher’s details as we are unable to accept any returns unless they are faulty. Please contact us if you have any questions.
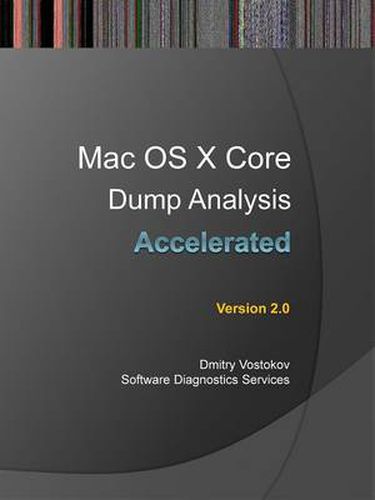
The full transcript of Software Diagnostics Services (former Memory Dump Analysis Services) training with 12 step-by-step exercises. Learn how to analyse app crashes and freezes, navigate through process core memory dump space and diagnose corruption, memory leaks, CPU spikes, blocked threads, deadlocks, wait chains, and much more. We use a unique and innovative pattern-driven analysis approach to speed up the learning curve. The training consists of practical step-by-step exercises using GDB and LLDB debuggers highlighting more than 30 memory analysis patterns diagnosed in 64-bit process core memory dumps. The training also includes source code of modelling applications written in Xcode environment, a catalogue of relevant patterns from Software Diagnostics Institute, and an overview of relevant similarities and differences between Windows and Mac OS X user space memory dump analysis useful for engineers with Wintel background. Audience: Software technical support and escalation engineers, system administrators, software developers, security professionals and quality assurance engineers.
$9.00 standard shipping within Australia
FREE standard shipping within Australia for orders over $100.00
Express & International shipping calculated at checkout
Stock availability can be subject to change without notice. We recommend calling the shop or contacting our online team to check availability of low stock items. Please see our Shopping Online page for more details.
This title is printed to order. This book may have been self-published. If so, we cannot guarantee the quality of the content. In the main most books will have gone through the editing process however some may not. We therefore suggest that you be aware of this before ordering this book. If in doubt check either the author or publisher’s details as we are unable to accept any returns unless they are faulty. Please contact us if you have any questions.
The full transcript of Software Diagnostics Services (former Memory Dump Analysis Services) training with 12 step-by-step exercises. Learn how to analyse app crashes and freezes, navigate through process core memory dump space and diagnose corruption, memory leaks, CPU spikes, blocked threads, deadlocks, wait chains, and much more. We use a unique and innovative pattern-driven analysis approach to speed up the learning curve. The training consists of practical step-by-step exercises using GDB and LLDB debuggers highlighting more than 30 memory analysis patterns diagnosed in 64-bit process core memory dumps. The training also includes source code of modelling applications written in Xcode environment, a catalogue of relevant patterns from Software Diagnostics Institute, and an overview of relevant similarities and differences between Windows and Mac OS X user space memory dump analysis useful for engineers with Wintel background. Audience: Software technical support and escalation engineers, system administrators, software developers, security professionals and quality assurance engineers.