Readings Newsletter
Become a Readings Member to make your shopping experience even easier.
Sign in or sign up for free!
You’re not far away from qualifying for FREE standard shipping within Australia
You’ve qualified for FREE standard shipping within Australia
The cart is loading…


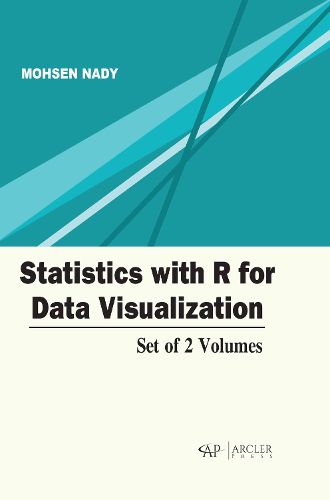
This book covers the use of R programming language for data visualization. The large real-world datasets can be quickly visualized to gain several insights from it using R. Whether the data is already clean or needs some preliminary steps before data visualization like data cleaning and wrangling, all these can be done using R to produce elegant, publication-ready, and exciting plots. This book covers different plot types from simple ones like univariate and bivariate plots (histograms, box plots, violin plots, scatter plots, density plots, bar graphs, pie charts, tree maps, beeswarm plots, Cleveland dot charts, line plots, etc) to more complex ones like mapping and visualizing patterns of missing data (upset plots, different Stamen map types with different zoom levels). All these were shown using free real-world data sets to illustrate the diverse capability of R for data visualization.
$9.00 standard shipping within Australia
FREE standard shipping within Australia for orders over $100.00
Express & International shipping calculated at checkout
This book covers the use of R programming language for data visualization. The large real-world datasets can be quickly visualized to gain several insights from it using R. Whether the data is already clean or needs some preliminary steps before data visualization like data cleaning and wrangling, all these can be done using R to produce elegant, publication-ready, and exciting plots. This book covers different plot types from simple ones like univariate and bivariate plots (histograms, box plots, violin plots, scatter plots, density plots, bar graphs, pie charts, tree maps, beeswarm plots, Cleveland dot charts, line plots, etc) to more complex ones like mapping and visualizing patterns of missing data (upset plots, different Stamen map types with different zoom levels). All these were shown using free real-world data sets to illustrate the diverse capability of R for data visualization.