Readings Newsletter
Become a Readings Member to make your shopping experience even easier.
Sign in or sign up for free!
You’re not far away from qualifying for FREE standard shipping within Australia
You’ve qualified for FREE standard shipping within Australia
The cart is loading…


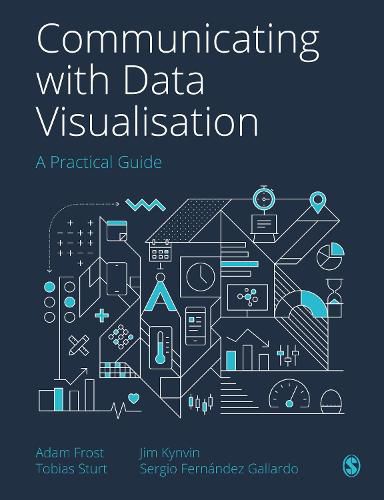
How can you transform a spreadsheet of numbers into a clear, compelling story that your audience will want to pass on?
This book is a step-by-step guide (honed through the authors’ Guardian masterclasses, workshops and seminars) to bringing data to life through visualisations, from static charts and maps to interactive infographics and motion graphics.
Introducing a four-step framework to creating engaging and innovative visualisations, it helps you to:
*
Find the human stories in your datasets
*
Design a visual story that will resonate with your audience
*
Make a clear, persuasive visual that represents your data truthfully
*
Refine your work to ensure your visual expresses your story in the best possible way.
This book also includes a portfolio of best-practice examples and annotated templates to help you choose the right visual for the right audience, and repurpose your work for different contexts.
$9.00 standard shipping within Australia
FREE standard shipping within Australia for orders over $100.00
Express & International shipping calculated at checkout
How can you transform a spreadsheet of numbers into a clear, compelling story that your audience will want to pass on?
This book is a step-by-step guide (honed through the authors’ Guardian masterclasses, workshops and seminars) to bringing data to life through visualisations, from static charts and maps to interactive infographics and motion graphics.
Introducing a four-step framework to creating engaging and innovative visualisations, it helps you to:
*
Find the human stories in your datasets
*
Design a visual story that will resonate with your audience
*
Make a clear, persuasive visual that represents your data truthfully
*
Refine your work to ensure your visual expresses your story in the best possible way.
This book also includes a portfolio of best-practice examples and annotated templates to help you choose the right visual for the right audience, and repurpose your work for different contexts.