Readings Newsletter
Become a Readings Member to make your shopping experience even easier.
Sign in or sign up for free!
You’re not far away from qualifying for FREE standard shipping within Australia
You’ve qualified for FREE standard shipping within Australia
The cart is loading…


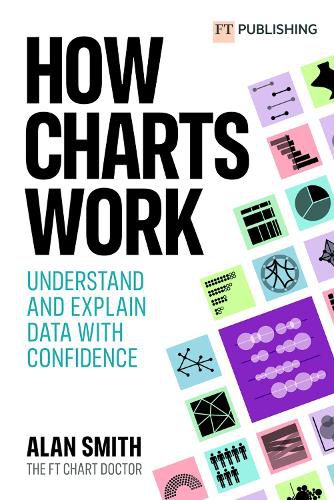
The Chart Doctor Book brings the secrets of effective data visualisation in a way that will help you bring data alive.
Charts, graphs and tables are essential devices in business, but all too often they present information poorly. This book will help you:
*
Feel confident understanding different types of charts, graphs and tables - and how to read them
*
Recognise the true story behind the data presented and what the information really shows
*
Know the principles and rules of how best to represent information so you can create your own information-driven (and beautiful) visuals
*
Design visuals that people engage with, understand and act upon
Don’t value design over information - present data persuasively.
Find the FT Chart Doctor’s columns here - https://www.ft.com/chart-doctor
$9.00 standard shipping within Australia
FREE standard shipping within Australia for orders over $100.00
Express & International shipping calculated at checkout
The Chart Doctor Book brings the secrets of effective data visualisation in a way that will help you bring data alive.
Charts, graphs and tables are essential devices in business, but all too often they present information poorly. This book will help you:
*
Feel confident understanding different types of charts, graphs and tables - and how to read them
*
Recognise the true story behind the data presented and what the information really shows
*
Know the principles and rules of how best to represent information so you can create your own information-driven (and beautiful) visuals
*
Design visuals that people engage with, understand and act upon
Don’t value design over information - present data persuasively.
Find the FT Chart Doctor’s columns here - https://www.ft.com/chart-doctor