Readings Newsletter
Become a Readings Member to make your shopping experience even easier.
Sign in or sign up for free!
You’re not far away from qualifying for FREE standard shipping within Australia
You’ve qualified for FREE standard shipping within Australia
The cart is loading…


This title is printed to order. This book may have been self-published. If so, we cannot guarantee the quality of the content. In the main most books will have gone through the editing process however some may not. We therefore suggest that you be aware of this before ordering this book. If in doubt check either the author or publisher’s details as we are unable to accept any returns unless they are faulty. Please contact us if you have any questions.
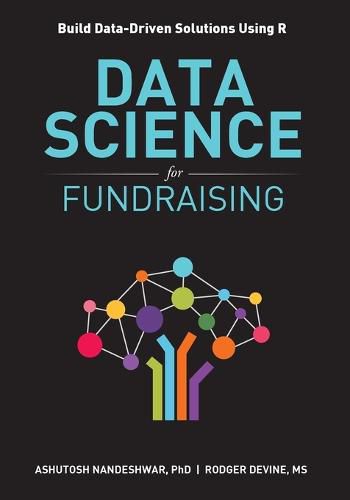
Discover the techniques used by the top R programmers to generate data-driven solutions.
Although the non-profit industry has advanced using CRMs and donor databases, it has not fully explored the data stored in those databases. Meanwhile, the data scientists, in the for-profit industry, using sophisticated tools, have generated data-driven results and effective solutions for several challenges in their organizations.
Wouldn’t you like to learn these data science techniques to solve fundraising problems?
After reading Data Science for Fundraising, you can:
Begin your data science journey with R
Import data from Excel, text and CSV files, and databases, such as sqllite and Microsoft’s SQL Server
Apply data cleanup techniques to remove unnecessary characters and whitespace
Manipulate data by removing, renaming, and ordering rows and columns
Join data frames using dplyr
Perform Exploratory Data Analysis by creating box-plots, histograms, and Q-Q plots
Understand effective data visualization principles, best practices, and techniques
Use the right chart type after understanding the advantages and disadvantages of different chart types
Create beautiful maps by ZIP code, county, and state
Overlay maps with your own data
Create elegant data visualizations, such as heat maps, slopegraphs, and animated charts
Become a data visualization expert
Create Recency, Frequency, Monetary (RFM) models
Build predictive models using machine learning techniques, such as K-nearest neighbor, Naive Bayes, decision trees, random forests, gradient boosting, and neural network
Build deep learning neural network models using TensorFlow
Predict next transaction amount using regression and machine learning techniques, such as neural networks and quantile regression
Segment prospects using clustering and association rule mining
Scrape data off the web and create beautiful reports from that data
Predict sentiment using text mining and Twitter data
Analyze social network data using measures, such as betweenness, centrality, and degrees
Visualize social networks by building beautiful static and interactive maps
Learn the industry-transforming trends
Regardless of your skill level, you can equip yourself and help your organization succeed with these data science techniques using R.
$9.00 standard shipping within Australia
FREE standard shipping within Australia for orders over $100.00
Express & International shipping calculated at checkout
This title is printed to order. This book may have been self-published. If so, we cannot guarantee the quality of the content. In the main most books will have gone through the editing process however some may not. We therefore suggest that you be aware of this before ordering this book. If in doubt check either the author or publisher’s details as we are unable to accept any returns unless they are faulty. Please contact us if you have any questions.
Discover the techniques used by the top R programmers to generate data-driven solutions.
Although the non-profit industry has advanced using CRMs and donor databases, it has not fully explored the data stored in those databases. Meanwhile, the data scientists, in the for-profit industry, using sophisticated tools, have generated data-driven results and effective solutions for several challenges in their organizations.
Wouldn’t you like to learn these data science techniques to solve fundraising problems?
After reading Data Science for Fundraising, you can:
Begin your data science journey with R
Import data from Excel, text and CSV files, and databases, such as sqllite and Microsoft’s SQL Server
Apply data cleanup techniques to remove unnecessary characters and whitespace
Manipulate data by removing, renaming, and ordering rows and columns
Join data frames using dplyr
Perform Exploratory Data Analysis by creating box-plots, histograms, and Q-Q plots
Understand effective data visualization principles, best practices, and techniques
Use the right chart type after understanding the advantages and disadvantages of different chart types
Create beautiful maps by ZIP code, county, and state
Overlay maps with your own data
Create elegant data visualizations, such as heat maps, slopegraphs, and animated charts
Become a data visualization expert
Create Recency, Frequency, Monetary (RFM) models
Build predictive models using machine learning techniques, such as K-nearest neighbor, Naive Bayes, decision trees, random forests, gradient boosting, and neural network
Build deep learning neural network models using TensorFlow
Predict next transaction amount using regression and machine learning techniques, such as neural networks and quantile regression
Segment prospects using clustering and association rule mining
Scrape data off the web and create beautiful reports from that data
Predict sentiment using text mining and Twitter data
Analyze social network data using measures, such as betweenness, centrality, and degrees
Visualize social networks by building beautiful static and interactive maps
Learn the industry-transforming trends
Regardless of your skill level, you can equip yourself and help your organization succeed with these data science techniques using R.