Readings Newsletter
Become a Readings Member to make your shopping experience even easier.
Sign in or sign up for free!
You’re not far away from qualifying for FREE standard shipping within Australia
You’ve qualified for FREE standard shipping within Australia
The cart is loading…


This title is printed to order. This book may have been self-published. If so, we cannot guarantee the quality of the content. In the main most books will have gone through the editing process however some may not. We therefore suggest that you be aware of this before ordering this book. If in doubt check either the author or publisher’s details as we are unable to accept any returns unless they are faulty. Please contact us if you have any questions.
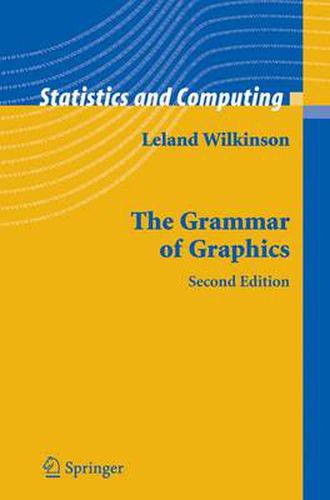
This book was written for statisticians, computer scientists, geographers, researchers, and others interested in visualizing data. It presents a unique foundation for producing almost every quantitative graphic found in scientific journals, newspapers, statistical packages, and data visualization systems. While the tangible results of this work have been several visualization software libraries, this book focuses on the deep structures involved in producing quantitative graphics from data. What are the rules that underlie the production of pie charts, bar charts, scatterplots, function plots, maps, mosaics, and radar charts? Those less interested in the theoretical and mathematical foundations can still get a sense of the richness and structure of the system by examining the numerous and often unique color graphics it can produce. The second edition is almost twice the size of the original, with six new chapters and substantial revision. Much of the added material makes this book suitable for survey courses in visualization and statistical graphics.
$9.00 standard shipping within Australia
FREE standard shipping within Australia for orders over $100.00
Express & International shipping calculated at checkout
This title is printed to order. This book may have been self-published. If so, we cannot guarantee the quality of the content. In the main most books will have gone through the editing process however some may not. We therefore suggest that you be aware of this before ordering this book. If in doubt check either the author or publisher’s details as we are unable to accept any returns unless they are faulty. Please contact us if you have any questions.
This book was written for statisticians, computer scientists, geographers, researchers, and others interested in visualizing data. It presents a unique foundation for producing almost every quantitative graphic found in scientific journals, newspapers, statistical packages, and data visualization systems. While the tangible results of this work have been several visualization software libraries, this book focuses on the deep structures involved in producing quantitative graphics from data. What are the rules that underlie the production of pie charts, bar charts, scatterplots, function plots, maps, mosaics, and radar charts? Those less interested in the theoretical and mathematical foundations can still get a sense of the richness and structure of the system by examining the numerous and often unique color graphics it can produce. The second edition is almost twice the size of the original, with six new chapters and substantial revision. Much of the added material makes this book suitable for survey courses in visualization and statistical graphics.